Kicker Pattern
A kicker signal, also known as a professional gap, occurs when the following conditions are met:
- Price is moving in a trend.
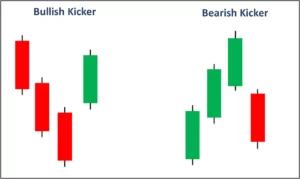
- Suddenly, a gap appears in the chart. A gap is defined as when the open price of one candle is not equal to the close price of the candle that precedes it; there is a gap in the price movement. The gap is in the opposite direction of the trend. For instance, imagine that price closed at 10 after rallying over a number of days from 2. The next day, price opens at 8. In this instance, we have a gap down, or a bearish kicker. Conversely, if price fell from 10 to 3 and then opened the next day at 5, it would signal a bullish kicker, a bullish sign for traders.
A kicker signal can be a very powerful sign that a trend is reversing. It is often interpreted as a sign that professional investors have quickly realized that a trend is over, and are looking to get out immediately. As such, this signal often precipitates a rapid reversal of the prior trend.