Hammer and Inverted Hammer Candlestick Patterns
The hammer and the inverted hammer candlestick patterns are among the most popular trading formations.
Both are reversal patterns, and they occur at the bottom of a downtrend.
Structure
The hammer pattern is a single-candle bullish reversal pattern that can be spotted at the end of a downtrend. The opening price, close, and top are approximately at the same price, while there is a long wick that extends lower, twice as big as the short body.
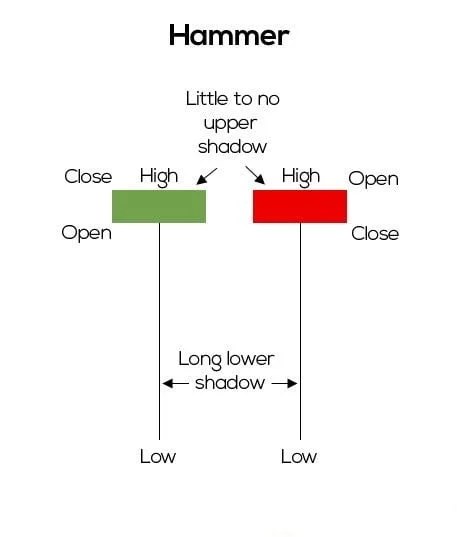
Irrespective of the colour of the body, both examples in the photo above are hammers. Still, the left candle is considered to be stronger since the close occurs at the top of the candle, signaling strong momentum.
On the other hand, an inverted hammer is exactly what the name itself suggests i.e. a hammer turned upside down. A long shadow shoots higher, while the close, open, and low are all registered near the same level.

Similar to a hammer, the green version is more bullish given that there is a higher close. This pattern always occurs at the bottom of a downtrend, signaling an imminent trend change. Again, the wick should be twice as big as the body.