What is the doji candlestick pattern?
A doji candlestick pattern is considered to be a transitional formation since it doesn’t signal either one of a continuation or a reversal of the trend. They are often considered to suggest indecision in a given market.
Structure and Types
A doji candle is dominated by wicks with very small bodies or no bodies at all. This formation can occur at the end of a downtrend, as well in the closing stages of the uptrend.

This means a doji can be classified as both a reversal and a continuation pattern, as it signals there is no firm outcome of who has control over the price action.
This has led some analysts to refer to doji as a ‘transitional’ formation. Doji candles are quite similar to spinning tops as they both send the same message: price neutrality and indecision.
The only real difference between these two is that the former have no body while the latters’ bodies are larger and longer.
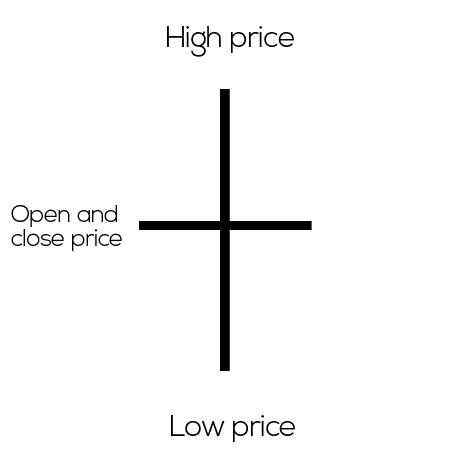
In addition to a classic or ‘neutral’ doji candle, depending on the opening and closing prices, there are three types of doji candlesticks:
- gravestone
- long-legged
- dragonfly
Gravestone doji candlestick pattern
A gravestone doji candle is a bearish reversal pattern which takes place at the end of the uptrend. The pattern signals that the bulls have pushed the price action higher, but were unable to force a close near the candle’s high.
As a result, the bears were able to return the price lower and the open, close, and low are all near one another.

As seen above, the gravestone doji candlestick pattern looks very similar to the shooting star pattern.
Both are seen as reversal bearish patterns with the only difference being that the gravestone doji has no body, but the open and close are at the same price, or extremely close to the same price, while a shooting star should ideally close at the bottom of the candle with a short (red) body.
The long upper wick signals the loss of control and momentum on the side of bulls and it signals the impending reversal of the price action.
Long-legged doji candlestick pattern
A long-legged doji, or a ‘rickshaw man’, is similar to a neutral doji, except for the fact that the wicks are longer on either side.
Again, this pattern signals indecision as there is no clear indication about the future trend.
A long-legged doji candlestick formation can occur in both strong uptrends and downtrends. If there is a series of doji candles in a row, the price action suggests that the current trend may be in the closing stages, and a reversal may take place soon.
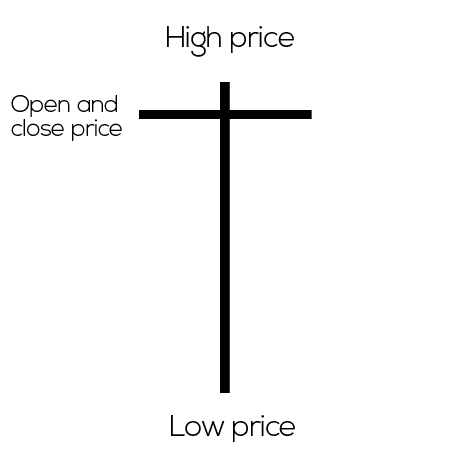
Dragonfly doji candlestick pattern
A dragonfly doji candlestick formation is the opposite of gravestone doji as the open, high, and close are near the same price in the upper half of the candle.
It can occur in both an uptrend and a downtrend, but it is considered to be stronger when it takes place at the bottom of the downtrend.
As you can see from the picture, a dragonfly doji looks very similar to a hanging man or a hammer candlestick pattern.
However, the same difference applies to the case of the gravestone doji and the shooting star, as doji has no body but only wicks, while the hanging man and hammer have a short body at the top of the candle.
Both patterns send the same message – the bears may lose the momentum soon and a reversal may be on the cards as the bears failed to force a close near the candle’s low.